Third party visibility into your Wi-Fi infrastructure
Wyebot presents at Mobility Field Day 10
It has been over a month since Anil Gupta, CTO and co-founder of Wyebot, presented at MFD-10 and there’s a good reason why I haven’t posted about them quite yet. I didn’t really have the time to get my hands on the sensors and dashboard. Over the holidays I had some time to play around with the sensor on my home network and man, I really like what they have to offer. Let’s get into it.

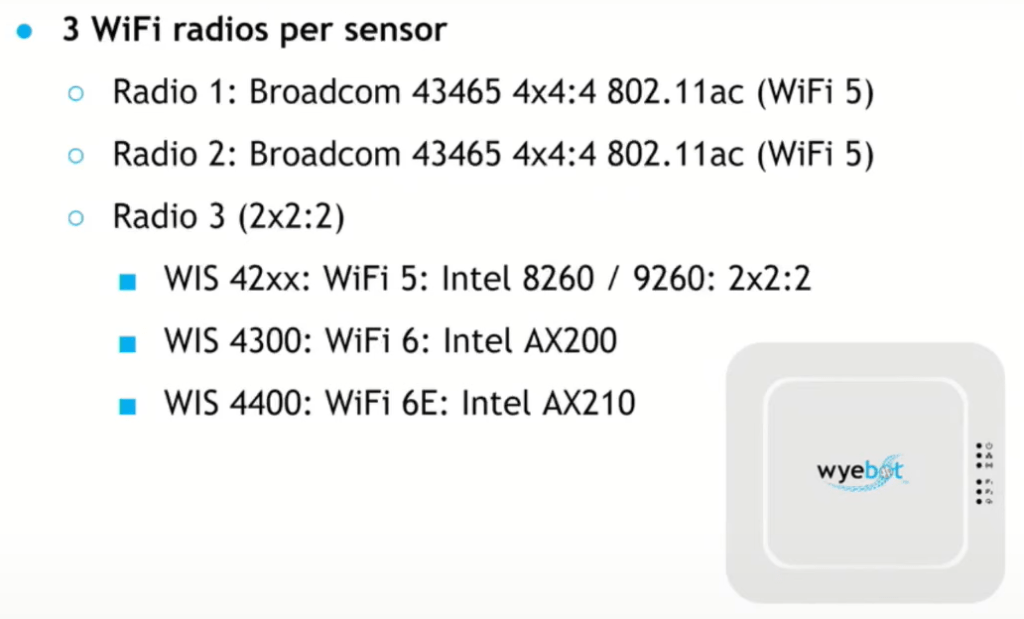
We’ll start out with the sensor. First off is the form factor, it’s about the same size as your typical indoor omi AP and it runs on .3at POE (mine is currently pulling 11.5W). There are three radios in each sensor. Two are fully passive for PACAPS and spectrum analysis. They will follow the nearest AP channels automatically or you can manually set it to follow a specific SSID or BSSID. The third radio is where you can select what flavor you need. There are Wi-Fi5, 6, and 6E capable options out there for you. The third radio is what they call multiple personality which allows you to perform passive scanning (especially important if you have a 6GHz capable network), wireless backhaul if you don’t have the ability to connect back to a switch, and third which is a whole host of network testing.
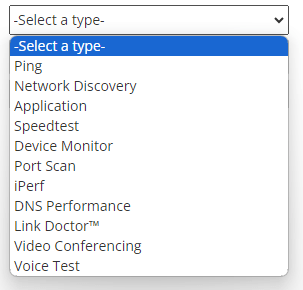
The test feature is where the device really starts to shine. It connects to your network via Wi-Fi and over the wire. It is capable of dot1x authentication on the Wi-Fi which is nice because you can actually test against your production WLANs rather than just a PSK test WLAN. You have 11 fully customizable test types available at this time. Tests can scheduled or run them on demand. My favorite so far is the video conferencing test that emulates a Zoom call. This is a great way to prove it’s not the wireless when you’re having Zoom issues on a single client, for example.


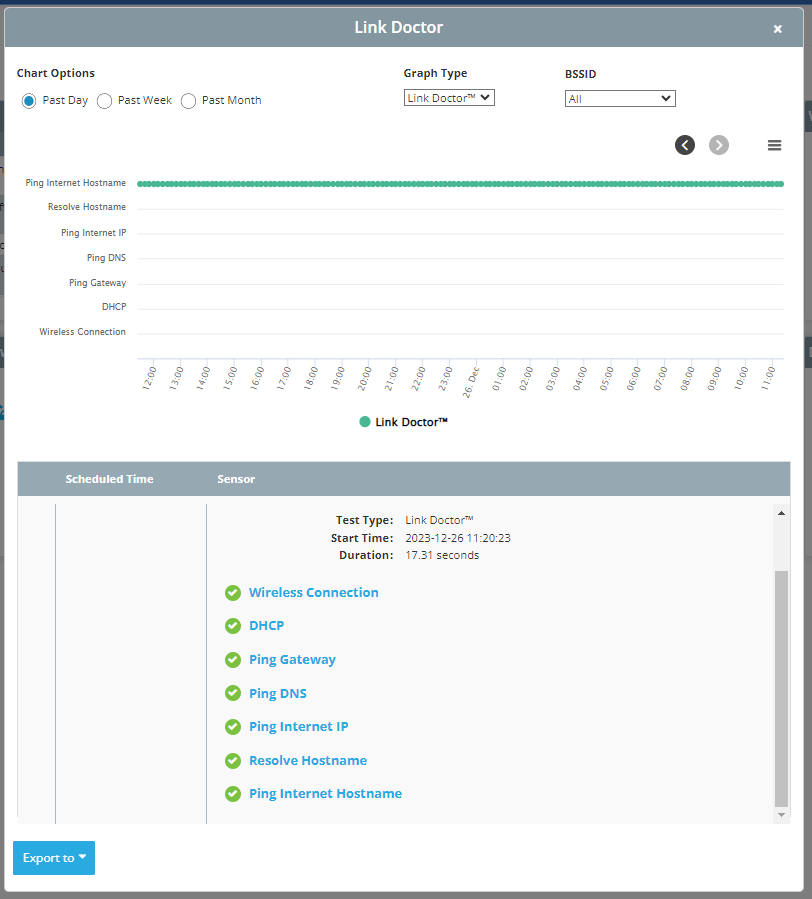
Something else I really like is the Link Doctor which gives you a quick snapshot of connectivity, DHCP performance, reachability to the gateway, DNS, and somewhere on the internet as well as resolving hostnames. All of these are customizable but out of the box reaches out to Google for most of these. It’s a super quick “at a glance” style visibility tool. All of the graphical output is also downloadable into reports you can provide clients or your stakeholders which is a really nice addition.
The last thing I want to touch on here is the PCAP function. There are tons of different ways to capture packets and we all have our favorites. I think where the Wyebot sensor brings a ton of advantage over some competitors in the space is with the rolling PCAP function. When capturing headers, you get about three days worth of data using internal storage alone. When paired with an encrypted USB micro SD adapter you can extend that out to several weeks depending on traffic. How many times have you received a call from someone on helpdesk telling you there’s a Wi-Fi problem that happened three days ago with no further information? It is extremely difficult to chase down some of these issues because you have to be sitting there with you capture device in hand and be lucky enough to have the failure happen at that moment. With the Wyebot, you can go back in time to snag the issue. I tested this by connecting to the network on my phone and then going back three hours later to pull the PCAPs and it worked perfectly. I was able to pull them into Wireshark and dig through.
The latest new addition to the Wyebot family is their client application. These app is currently available for Windows machines with a promise of MacOS, iOS, and Android coming soon. If you have ever played around with 7Signal’s Mobile Eye it is very similar. It provides you information from the client perspective which is invaluable data to have.
There are lots of other really cool features available to you on the dashboard and I encourage you to go watch their full presentation here. I mentioned above that there are a couple of vendors in the space and honestly, each of them have their advantages and disadvantages. I really like the easy plug-n-play setup of the Wyebot and especially the PCAP functionality. I think anyone running a large wireless network really does need third party visibility. I’m not saying our vendors are lying to us about the network in their own dashboards, but they can only tell us so much. When you’re using the same devices to test themselves they’re going to work better together. This is where the third party device comes in handy.