
At Mobility Field Day 10, Cisco presented on several new features and APs. It was a bit like drinking from a firehose. There are a lot of great things already in the ecosystem and a lot of exciting things to come. Rather than just recap the whole presentation (you can watch it here), I wanted to focus on one specific area. The Cloud-Enabled model of deploying wireless solutions.
There is a big rush to cloud management across the industry. There are several big-name vendors that are cloud first or cloud only. This isn’t a bad thing or wrong by any means. It’s just a different philosophy. Cisco continues to be an on-prem first model within the Catalyst ecosystem. If you want cloud managed, you have the Meraki line available. I think they both have their places depending on your business model and size. My place employment is a large hospital system and we are very much an on-prem first organization. However, it would be nice to have some of the features that Meraki has built in available to us. Enter the Cloud-Enabled/Hybrid option.
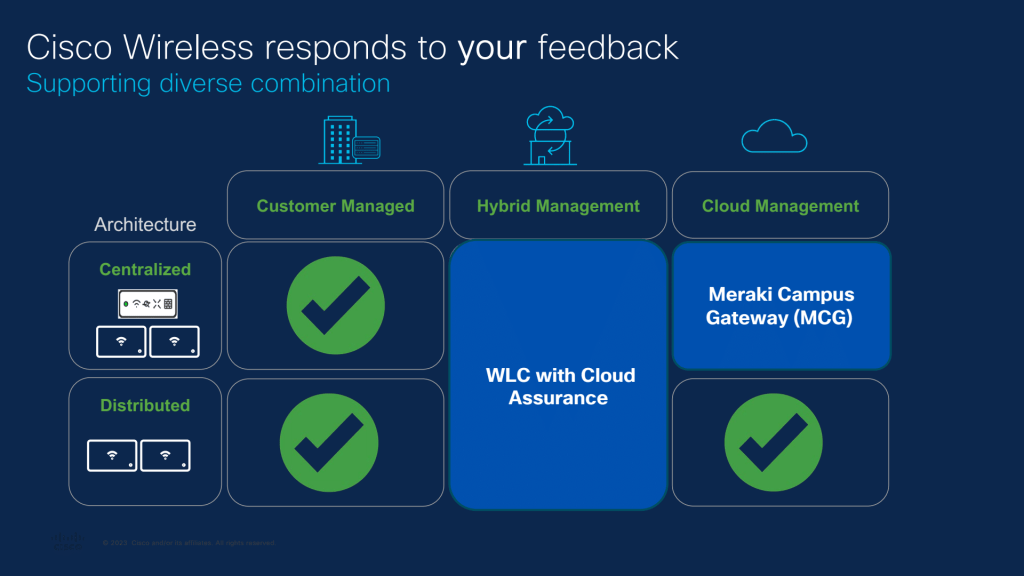
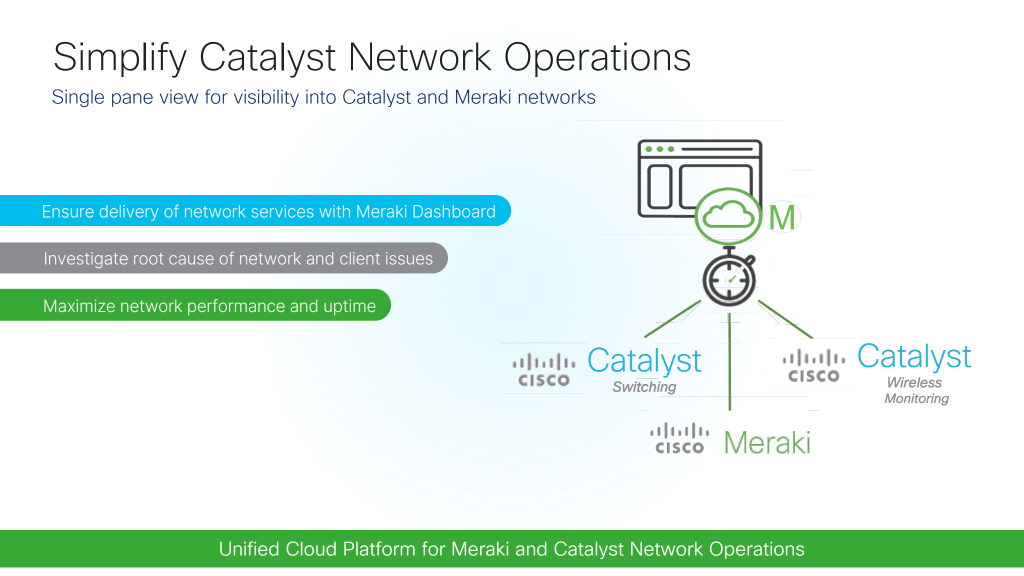
Cloud-enabled allows you to retain control on prem using Catalyst controllers while bringing in the cloud monitoring and troubleshooting tools available in the Dashboard to your fingertips. In my opinion, this is a huge win especially for larger companies with more siloed teams. With the Meraki Dashboard you have a single pane of glass for delivery assurance, troubleshooting, and performance monitoring. This takes a lot of easier tickets off of the wireless SME’s desk and keeps it down at your helpdesk or tier 1 support. A few low hanging fruit issues that can be quickly identified as well as a couple of new features:
- Event correlation and monitoring
- Problem analysis looking for larger root cause issues impacting wireless
- Performance, utilization, and capacity monitoring
- Change tracking and configuration drift analysis
- API integration for easy data exfiltration
Another added value is Catalyst and Meraki in the same place. We deploy Meraki in a few smaller sites and now we can see those sites in the same place as our traditional on-prem controllers. This is a pretty big value add for me since we do have some Meraki deployments.
“But Mike, what about licensing costs?” Ah, no worries! Your existing DNA licenses allow for Dashboard integration so you don’t have that concern.
“Is this a replacement for Catalyst Center (the management platform formally known as DNAC)?” No, this is mostly for easy and quick monitoring and troubleshooting. Catalyst Center and Assurance still have their place for deeper dives and more complex device configuration and management.
“What requirements are there to put my 9800 into the Dashboard?” I’m glad you asked. You need to be on 17.12.3 or 17.15.1 or later in order to put them into Dashboard monitoring. There is also a max of 2,000 APs and 20,000 clients per controller. You also need to make sure your MRs and Catalyst APs are in different “Dashboard Networks”. If you’re familiar with Meraki, this is pretty straight forward.
“How difficult is it to integrate my 9800?” It’s as easy as creating a new network in Dashboard and using the device ID you pull from your 9800 to adopt the device. It’s basically exactly like adopting Meraki devices. Very straight forward, especially if you have Meraki experience.
A couple of quick takeaways for me. I’m really excited to get a pair of lab 8900s up to 17.12.3 to drop them into the Dashboard. I’m looking forward to providing another tool for our operations group to efficiently troubleshoot “Wi-Fi issues”. It will also be nice to monitor the overall health of different hospitals at a quick glance. My job is primarily design and deployment on projects but I do get pulled into a lot of t-shooting calls. Sometimes those things are pretty simple, and while I don’t mind helping out and training up folks, I would prefer to keep that time dedicated to other things.
What are your thoughts? If you currently deploy Catalyst controllers do you plan on adding them to Dashboard for monitoring?

One comment